

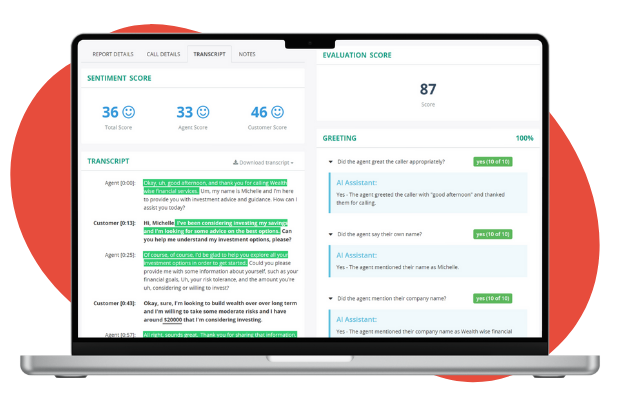
Automate QA And Elevate Agent Performance
Whether you are aiming to improve customer experience or sales outcomes, it all starts with your agents. MiaRec's platform offers you advanced Auto QA capabilities that evaluate 100% of conversations using advanced AI and fully customizable scorecards.
Gain complete visibility into agent performance, reduce evaluation time, increase coaching precision, and ensure compliance at scale.
Key Capabilities
- Automated QA
- Call Categorization
- Custom Scorecards
- Auto QA is included in CX and Revenue Intelligence
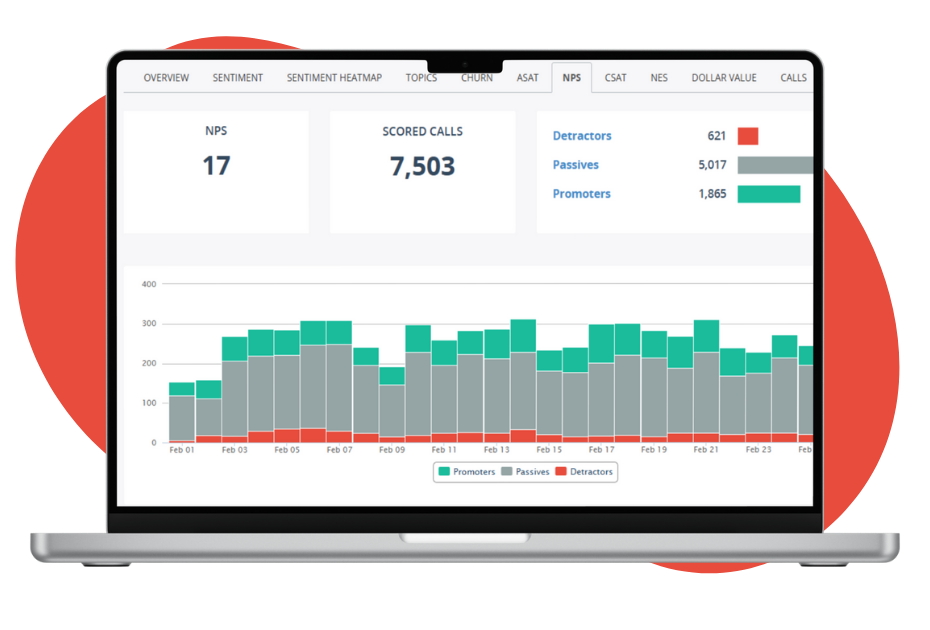
Understand Customer Experience
MiaRec CX Intelligence analyzes every conversation to reveal what customers are experiencing and why — without relying solely on post-call surveys.
Track sentiment (using CSAT), detect friction, and identify churn risk early so you can take action before customer satisfaction declines.
Key Capabilities
- CSAT, NPS & NES Insights
- Churn Risk Detection
- Call Reasons & Service Drivers
- Customer Sentiment Analysis
Turn Conversations Into Revenue Performance Insight
MiaRec Revenue Intelligence uncovers buying signals, objection patterns, and deal drivers hidden inside your conversations.
Identify why deals are won or lost, improve sales consistency, and strengthen forecasting accuracy with objective, conversation-based insight.
Key Capabilities
- Buying Signals
- Sales Lost Reasons
- Lead & Deal Insights
- Revenue Trend Analysis

Ask Your Data Anything
MiaRec Ask AI gives every team instant access to conversation intelligence through natural-language queries.
Surface trends, root causes, and performance drivers in seconds — without waiting for analysts or building custom reports.
Key Capabilities
- Natural Language Queries
- Instant Root Cause Analysis
- Drill-Down Insights
- AI-Powered Recommendations